Economic and political upheavals—such as financial crises, regulatory shifts, or social unrest—often leave detectable traces in national electricity usage patterns. A new study explores how fluctuations in power consumption can serve as an indirect but informative signal of systemic change in complex socioeconomic environments, focusing on the United States and Turkey. n nCritical transitions in society, whether triggered internally or by external shocks, frequently disrupt normal behavioral patterns. These disruptions can manifest in measurable ways, including altered energy demand. While traditional forecasting relies on economic indicators like GDP or employment, this research proposes an alternative: using electricity consumption as a proxy for broader societal dynamics. Historical data shows a strong correlation between energy use and economic activity, particularly in industrialized nations. Although exceptions exist, especially in contexts where corruption or demographic shifts influence energy demand independently of economic performance, the overall link remains robust. n nThe study applies a hybrid methodology combining dynamical systems theory and machine learning to identify anomalies in electricity usage that precede major turning points. First, raw electricity data is normalized into a fluctuation time series to remove seasonal and long-term trends. Then, recurrence quantification analysis is used to assess the predictability—or determinism—of the system over time. Periods of unusually high or low determinism are flagged as potential critical transitions. n nFor the U.S., the analysis draws on decades of stable electricity data reflecting a mature, market-driven economy with consistent governance. In contrast, Turkey’s data includes multiple overlapping periods of political and economic volatility, offering a test case for the model’s ability to detect crises in less stable environments. The Human Development Index (HDI) trajectory of both countries further contextualizes their development paths: the U.S. maintains a consistently high HDI, while Turkey has progressed from medium to very high human development over recent decades. n nThe model identifies extreme deviations in determinism—either excessive regularity or chaos—as markers of systemic stress. For instance, prolonged drops in predictability may signal economic instability, while unusually rigid patterns could reflect heightened state control or crisis-driven behavioral conformity. These anomalies are then used to train a neural network ensemble capable of forecasting future disruptions within a probabilistic framework. n nUnlike conventional time-series models that assume continuity, this approach separates system characterization from prediction, allowing it to detect novel or qualitatively unique events. The neural network, based on reservoir computing, learns temporal patterns without relying on predefined equations, making it adaptable to complex, evolving systems. n nWhile long-term forecasting of critical events remains inherently uncertain—especially in chaotic systems—the study aims to provide short-term probabilistic warnings. By analyzing historical electricity fluctuations, the method identifies signatures of past crises and uses them to anticipate future ones. This could offer policymakers and analysts an early-warning tool, particularly when official data is delayed or unavailable. n nAlthough still experimental, the approach highlights the potential of indirect metrics in understanding national-level dynamics. As societies generate ever more granular data, unconventional indicators like energy use may become increasingly valuable in anticipating economic and political inflection points. n
— news from Springer Nature
— News Original —
Forecasting critical economic & political events via electricity consumption patterns in the United States of America and Turkey
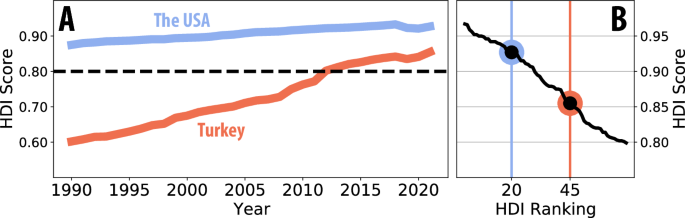
Critical events, encompassing phenomena like earthquakes, terrorist attacks, and financial crises, carry significant ramifications such as critical system damage, political instability, turmoil, severe injury, or impacts on off-site communities Scheffer (2020). They exert a pivotal influence on the evolution of diverse systems, ranging from insect communities to planetary and socioeconomic systems engineered by humans. Interestingly, these transformative events typically originate externally to the affected system, yet they can trigger crises within interconnected systems, leading to cascading effects. This phenomenon occurs as a result of the reorganisation of components and functions during critical transition periods, often accompanied by atypical behaviour in the observed system. In the context of large interconnected socioeconomic systems, these changes may manifest as military actions, regulatory measures on capital, or even the erosion of social constructs such as trust and morals. Predicting such events is deemed crucial for managing system behaviour, ensuring desired functionality, and implementing preventive measures against potential disasters. n nPredicting the future has captivated human interest since ancient civilisations. Early endeavours, such as astronomy, laid the groundwork for recognised natural sciences focused on observing and predicting celestial motions (Evans (1998)). Over time, prediction practices expanded beyond scientific disciplines into various facets of society. Notably, machine learning has emerged as a transformative scientific breakthrough, especially in the field of predictions (Murphy (2012); Sejnowski (2020)). The traditional assumption of forecasting based on time series analyses is that events that occurred in the past will continue in a similar way in the future, i.e., business-as-usual (BAU)(Bugmann et al. (2017); Pike et al. (2014)). However, the current prediction techniques encounter challenges due to outliers, also termed critical or black swan events, which correspond to data points significantly different from the rest (Aguinis et al. (2013); Axelrod et al. (2021)). The identification and prediction of critical events pose persistent methodological challenges (Cousineau and Chartier (2010); Porwal and Raftery (2022); Sornette (2002)). n nCertain events, such as earthquakes originating from outside the system, cannot be predicted by measuring the system. In contrast, other critical events arise solely from complex interactions within a system and its self-organised behaviour and can be predicted using the measurements from the system. Critical events, such as economic or political crises for countries in a globally interconnected world, are usually attributed to both internal and external causes. External factors can trigger tipping points and the dormant critical behaviour within systems. The underlying motivation for this study is that, as long as these subcritical processes of the system contribute to the measurements, it is theoretically possible to identify their fingerprints and predict their critical behaviour. In other words, it is possible to predict critical periods when a country’s intrinsic elements contribute to the emergence of a crisis. n nThe investigation of large and complex socioeconomic systems, central to our research, necessitates the use of indirect measures or proxies to discern their critical behaviour. This proxy is responsible for capturing traces of actions of individuals and structural bodies that comprise this socioeconomic entity. Energy consumption emerges as a pertinent proxy due to its historical significance in societal well-being, as well as its intrinsic connection to the economic prosperity and political frameworks (Koilakou et al. (2024); Ouedraogo (2013); Sarkodie and Adams (2020)), notably since the Industrial Revolution. While variations exist across countries, periods, and specific circumstances – and in some cases, the exact nature of their relationship remains inconclusive (e.g Akarca and Long (1980); Abosedra and Baghestani (1989); Kraft and Kraft (1978); Stern (2000); Thoma (2004); Yu and Hwang (1984)) – a strong correlation has been observed between electricity consumption and economic activity. More robust findings have been reported in countries such as Japan (Erol and Yu (1987)), the Philippines and South Korea (Yu and Choi (1985)), and Ghana (Ammah-Tagoe (1990)), as well as in industrialised nations more broadly (Erol and Yu (1987)). However, the results are not universally consistent, and many of the data sets utilised in these studies are not recent. Moreover, the implications of electricity consumption trends vary across institutional and societal contexts. Dokas et al. (2022) demonstrated that, in some cases, energy and electricity consumption increases may be driven by factors such as bribery, corruption, and private sector financing, potentially evolving independently of political stability. Similarly, Su et al. (2022) found that shifts in social structures, including urbanisation and an ageing population, influence renewable energy consumption, indicating that factors other than economic variables may account for the changed energy use. n nThe close relationship between per capita energy use and income per capita has been acknowledged for more than six decades ago (Schurr and Netschert (1960); Turvey and Nobay (1965)) and it has even been employed for the long-term forecast of energy consumption (Ediger and Tatlıdil (2002); Sterman (1988)). Although this relationship may differ substantially between countries, change over time (Adams and Miovic (1968); Van den Bergh (2013); Brookes (1973); Csereklyei and Stern (2015); Nguyen (1984)) and decoupling can occur (Aramendia et al. (2021); Kalimeris and Bithas (2012); Moreau and Vuille (2018); Sanyé-Mengual et al. (2019)), energy consumption and economic growth have remained closely intertwined on a global scale (Brilakis et al. (2021); Dai et al. (2022); Kalimeris and Bithas (2012)). Arora and Lieskovsky (2016) reaffirmed that electricity consumption can indicate U.S. economic activity, emphasizing that “electricity use and economic conditions should move together.” Similarly, Shakouri et al. (2023) demonstrated the existence of tight feedback relationships between electricity consumption and economic activity in the U.S. n nThere is also a strong correlation between energy and social development that has been recognised since the beginning of the 1970s (Starr (1971)). Human Development Index (HDI), developed by the United Nations Development Program (UNDP), was introduced in 1990 with the recognition that income alone does not adequately capture societal well-being (Dowrick and DeLong (2003); Hopkins (1991); Sen (1999)). Comprising three equally weighted socio-economic indicators —long and healthy life, education, and standard of living — HDI aims to provide a comprehensive measure of human development with proposed variants such as the Energy-adjusted Human Development Index (EHDI) integrating an energy component into the HDI (Ediger and Tatlıdil (2006)). Energy influences all three indicators of HDI either directly or indirectly (Amer (2020); Pirlogea (2012); Van Tran et al. (2019)). Low HDI countries typically utilise significantly less energy compared to those with medium to high HDI levels during the early stages of development. However, even small increases in energy consumption per capita can lead to substantial improvements in the HDI for countries with low levels of development, while such increases have minimal impact on countries with high HDI levels (Cleveland and Morris (2013); Patt et al. (2010)). Nonetheless, higher energy-consuming countries may reduce their per capita energy usage without experiencing significant declines in health, happiness, or other societal outcomes (Jackson et al. (2022)). Economic issues are also linked to the policies implemented within the country. Therefore, sudden or delayed changes in electricity consumption are closely tied to the country’s economic and political developments. While long-term changes in electricity consumption can be expected due to efficiency improvements, innovations, and technological advancements, such changes are also influenced by the broader economic and political context of the country. In summary, behavioural changes within a country’s institutions and society are strongly reflected in its electricity consumption patterns. Critical transition periods, where these changes become more prevalent, can often be detected from electricity measurements. n nThe objective of this study is to predict significant upcoming economic and political critical transitions (turning points) in the United States and Turkey by using their electricity consumption. For this purpose, a methodology was devised, integrating dynamical systems theory (Marwan et al. (2007); Xu et al. (2008)) and machine learning techniques (Arcomano et al. (2020); Pathak et al. (2018)), to detect historical dynamical critical transitions associated with economic and political pivotal moments. Subsequently, ensemble techniques were employed to forecast likelyhood of potential crises. n nThis methodology requires a reliable history of electricity consumption, available primarily in developed countries with established electricity grids and minimal energy shortages. Differential factors, such as dissimilar development histories and state-society relations, were considered among these developed countries. The USA was chosen for its democratic system, largest market-driven economy, and historically robust political framework. In terms of data properties, the US data contains long spans of BAU operation to test the method’s ability to extract the business-as-usual behaviour and the deviations from it. In contrast, Turkey is classified as an upper-middle-income, newly industrialised, mixed-market economy country by the IMF and has experienced disruptions to its democratic process and political framework in recent times. In terms of data properties, Turkey’s data contains many overlapping extreme periods, which test the limits of the method’s ability to simulate the system undergoing a crisis. Historical HDI scores of the selected countries are illustrated in Fig. 1(A). Throughout the analysed period, the USA maintains its status as one of the most highly developed countries globally, with a consistent HDI score. Conversely, Turkey is undergoing a transition from a country of medium to very high human development over time. Consequently, extreme periods in these countries are expected to manifest with qualitatively different critical processes. n nStudies on the estimation of economic and political events are not as common in the literature as the estimation of consumption, production or other numerical economic parameters such as price and value. One of the best-known of the very few studies is the best-seller book titled Limits to Growth, which modeled the flow of energy through human and natural systems by using World3 computer simulation (Meadows (1972)). In their well-known book titled Secular Cycles, Turchin and Nefedov predicted that the West would experience political chaos by 2020 using a quantitative methodology called cliodynamics (Turchin and Nefedov (2009)). Indeed, chaos theory, recognised as a pivotal scientific advancement of the twentieth century for uncovering the inherent unpredictability within natural and humankind made systems, asserts the impossibility of making long-term or precise predictions about critical transition times for complex systems. Consequently, this study diverges from the aforementioned works by aiming to develop a probability measure for anticipating critical events within a short time frame for both the United States of America and Turkey. n nThe methodology of this paper aims to identify critical periods in a country and estimate potential future critical periods by extrapolating the temporal patterns found in its electricity consumption history. Traditional approaches for detecting critical transitions in dynamical systems rely on detecting statistical changes in time-series measures such as variance or auto-correlation to recognise the signatures of the system approaching a critical state (Lenton (2011); Scheffer et al. (2009)). Machine learning methods, which can learn the patterns in the data, such as support vector machines, random decision forests, and recurrent neural networks, are also ideally suited for the recognition of these early warning signals and are commonly used for this purpose (Canabarro et al. (2019); Zhao and Fu (2019)). However, machine learning-driven early warning detection methods are tuned to recognise special conditions of the system prior to a particular critical transition and can realistically only learn the types of transitions they encounter in their training data. In real life, each transition period of a country can be qualitatively unique and may require unique special conditions to materialise. To be able to predict unique and novel periods, this study separates the dynamical characterisation of the system and its prediction into distinct and noninteracting tasks. n nFirst, the electricity consumption series is converted into a fluctuation time series using an implicit normalisation procedure. The resulting time series is then analysed using recurrence quantification measures to build determinism time series. This series reflects the time evolution of the regularity/predictability of the system. With enough measurements, the determinism time series can be seen to fluctuate in a particular spectrum of regularity. Using a confidence interval, this spectrum defines the ordinary operation of the country and the extraordinary periods, where the system is too regular or irregular compared to its entire history. These extraordinary periods present the turning points identified in the fluctuation series, and their correspondence to critical periods of the country is established in the identification step. n nIn the next step, a neural network ensemble with recurrent connections is used to predict the fluctuation time series. This approach is model-free, as each individual neural network embodies many random models depending on the connections of its neurons, and the best models are assigned larger weights after training. Different neural networks (or predictors) in the ensemble have different best models, and their predictions come from a different set of models. This ensemble is then used to create probabilistic measures for detecting system transitions with respect to the identified bounds for the historically typical operation of the country. An illustration and executive summary of the Method can be seen in Fig. 2. Technical details about the methodological components are given in their respective subsections where these procedures are explained. n nTime series preprocessing n nTime-series data, a sequence of observations recorded successively over a period, constitutes one of the most widely utilised scientific materials for understanding the past and predicting the future Lacasa et al. (2008); Nelson et al. (2021). The electricity consumption data sets used in this study, comprising trends (refer to Figs. 3 and 6), are analysed in subsequent analyses that necessitate time series with stationary running means and envelopes Therefore, as a critical preprocessing step, the electricity consumption time series ct must be transformed into a stationary fluctuation time series Φ(t), while maintaining the dynamical signatures in the data. This is done by employing moving normalisation to eliminate the first and second central moments of the data within a timeframe of 2L months. The reasoning behind this choice is that the method avoids any functional detrending procedure or seasonality adjustments. This is not only because these explicit procedures tend to introduce dynamical artifacts but also because it is assumed that trends and other temporal patterns are subject to change during the course of measurements. The selection of the timeframe (2L) is pivotal for multiple reasons. Firstly, it must be a multiple of 12 (months) to mitigate bias stemming from monthly trends. Secondly, it should be sufficiently extensive to encompass and mitigate the impact of macro trends on the system, yet small enough for the resultant fluctuation series to maintain a stationary envelope even in the case of strong trends. The local moving average ({ bar{C}}_{t} ) and the fluctuation series Φ(t) are calculated using the following equations: n n$${ bar{C}}_{t}= frac{1}{2L-1} mathop{ sum } limits_{i=t-L}^{t+L-1}{c}_{i}$$ n n(1) n n$$ Phi (t)= frac{ left({c}_{t}-{ bar{C}}_{t} right)}{ sqrt{ frac{1}{2L-1} mathop{ sum } nolimits_{i = t-L}^{t+L-1}{({c}_{i}-{ bar{C}}_{i})}^{2}}}$$ n n(2) n nEach data point in Φ(t) corresponds to the electricity usage compared to the associated month within the time frame, [t − L, t + L). The fluctuation series Φ(t) serves as a stationary dynamical proxy of ct and is utilised throughout this study to derive the determinism series and train the neural networks. Time window 2L is chosen to be the largest multiple of 12 months which yields a stationary time series. n nRecurrence quantification analyses n nIn this work, electricity use fluctuations are investigated to characterise the predictability of their temporal patterns using the recurrence plot. The recurrence plot (RP) (Donner et al. (2011); Eckmann et al. (1987); Marwan et al. (2007)) constitutes a potent method for discretely representing the recurrent behaviour of a dynamical system with limited measurements. It has been employed to quantify dynamical system behaviour in various fields such as earth science (Donges et al. (2011); Eroglu et al. (2016)), economics (Hirata and Aihara (2012)) and physiology (Zimatore et al. (2021)). n nThe RP (see Fig. 2 Detection Panel) is a matrix wherein the entries represent Poincaré recurrences of a dynamical system’s phase-space states. According to the Poincaré recurrence theorem, after a sufficiently long but finite time, a trajectory ({ vec{x}}_{i} in {{ mathbb{R}}}^{m} ) for i = 1, …, N must revisit the ϵ-neighborhood of a previous state. The RP for a trajectory ({ vec{x}}_{i} ) is defined as the time vs. time matrix by the following equation: n n$${R}_{i,j}( epsilon )= Theta ( epsilon -| | { vec{x}}_{i}-{ vec{x}}_{j}| | )i,j=1, ldots ,N$$ n n(3) n nϵ represents a threshold distance, ∣∣ ⋅ ∣∣ denotes a distance measure defined on the state space, and Θ(y) = 1 if y≥0 and 0 otherwise Marwan et al. (2007). While several techniques have been proposed for selecting an optimal recurrence threshold ϵ, our choice is to maximise the variation over time in the dominance of the diagonal entries of this matrix. n nThe recurrence patterns of the RP can be quantified to deduce the dynamical properties of a system, and this quantification is capable of capturing regime changes such as extreme events in climate systems (Marwan et al. (2021); Ozdes and Eroglu (2023)), and economic crises (Addo et al. (2013)). Among various structural features, diagonal lines in the RP, parallel to the main diagonal, indicate periods when a trajectory follows locally neighboring paths. These lines are ample in the case of periodic or well-behaved dynamics and rare otherwise. Therefore, comparing the abundance of recurrence points forming diagonal lines with the individual points in the RP measures the predictability of the dynamical systems. For this study, these diagonal lines correspond to approximate delayed repetitions of some patterns in the electricity fluctuation data. The determinism (D) of the RP quantifies predictability by assessing the fraction of points lying on diagonal lines relative to all points, and is expressed by the equation: n n$$D= frac{{ Sigma }_{l = {l}_{min}}^{N}l{ mathcal{P}}( epsilon ,l)}{{ Sigma }_{l = 1}^{N}l{ mathcal{P}}( epsilon ,l)}$$ n n(4) n nwhere ({ mathcal{P}}( epsilon ,l) ) denotes the count of diagonal lengths corresponding to the RP threshold ϵ and the associated diagonal lengths l. The shortest length considered is denoted as lmin = 2. The RP is computed utilizing the Euclidean distance norm, defined as ∣x, y∣ = ∣x − y∣ for one-dimensional time series. The threshold distance ϵ is selected to maximise the variance exhibited by the determinism series derived from the time series. n nTo establish a measure of predictability for a timeline, sliding windows analysis Trulla et al. (1996)) is employed on the fluctuation time series (Φ) by defining a recurrence frame size of 2h. D(t), representing the determinism at time t, is derived from the partial recurrence plot formed from overlapping data segments Wt = Φ(ti)∣ti ∈ (t − h, t + h). Incidences of high determinism values in this time series reflect the perseverance of the temporal patterns in the data, and low determinism values correspond to more chaotic or random sequences. n nThe recurrence frame is set to 2h = 48 months or exactly 4 years for the electricity use fluctuation data in this study to minimise the effect of monthly trends further. This selection implies that the empirical calculation of the most recent D(t) will lag behind the most recent data by 24 months. n nEstimation of extrema to identify critical periods n nOnce the determinism timeline for a country is calculated, a confidence interval spanning 2 standard deviations below and above the mean of determinism series D(t) is used to define the bounds of the system’s business-as-usual behaviour. Thus, for the scope of this article, BAU is defined as the operation of the system in times when this operation is not too regular or irregular with respect to all other times. Note that, while this choice of 2 standard deviations of the determinism for the BAU regime containing roughly 95% of the data is somewhat arbitrary, it has no effect on the determinism timeline or its peaks and typically only affects the estimated span of unusual periods. n nExtended periods where D(t) remains below the lower bound of the confidence interval (Δdown) suggest transient chaotic fluctuations, typically observed during economic crises, periods of volatility and general disruption of temporal patterns. Conversely, if D(t) exceeds the upper bound of the confidence interval (Δup), it indicates highly predictable fluctuations, characteristic of periods marked by system crises and strong regulation where the stronger temporal patterns emerge. Both types of unusual system behaviour are characterised as extreme periods in a country’s electricity consumption history. These extreme periods are hypothesised to indicate extreme conditions or critical behaviour of the country. n nNeural network prediction n nTo forecast fluctuations in electricity usage, high-dimensional network models Sejnowski (2020) are used to learn the one-time map from the measurement space, or the state evolution of the system. Recurrent Neural Networks (RNNs) can identify the temporal patterns in the data by embedding the time series in higher dimensional networks. For a stateful model with memory, we opt for the reservoir computing framework, an RNN architecture developed independently by Jaeger (2001) Jaeger (2001) and Maass (2002). Maass et al. (2002). A reservoir computer comprises a single hidden recurrent layer with N neurons (N = 1000 for this work) Pathak et al. (2018a, b). The input vector u(t) is transmitted through an I/R (input-to-reservoir) coupler with weights Win to the reservoir (R), a high-dimensional dynamical system. The reservoir receives inputs at discrete time steps t. Described by an N × N matrix A representing its recurrent connection weights, the reservoir layer’s state r(t) is determined by the activation states of its N neurons. Employing the hyperbolic tangent (tanh) activation function, the reservoir dynamics are expressed as: n n$$r(t+ Delta t)=(1- alpha ) cdot r(t)+ alpha cdot tanh [A cdot r(t)+{W}_{in} cdot u(t)]$$ n n(5) n nwhere α represents the leaking rate, which governs the memory retention of the reservoir. Subsequently, the reservoir’s state (r(t) in {{ mathbb{R}}}^{N} ) is linearly transformed through the R/O (reservoir-to-output) mapping, utilizing weights Wout, to generate the output v(t), expressed as v(t) = Wout ⋅ r(t). Once a training set u(t), v(t) is available, the R/O mapping is determined through linear regression to minimise test error, using the following optimisation approach: n n$${W}_{out}=X cdot {R}^{T}{(R cdot {R}^{T}+ lambda I)}^{-1}$$ n n(6) n nwhere X represents the data time series x0, …, xM depicted as a 1 × M vector, and R signifies the M × N matrix containing the corresponding reservoir states. The symbol ⋅ T denotes the matrix transpose operation. Additionally, λ denotes the regularisation parameter utilised for Tikhonov regularisation employing least squares regularity Tikhonov (1943). This method, also known as ridge regression, mitigates overfitting in the models by neutralizing the influence of uninformative neurons Srivastava et al. (2014). The regularisation parameter λ is set to 10−8 to nullify output weights below this threshold value. n nThe most critical aspect of this method involves the selection of the reservoir adjacency matrix A, describing the structured assembly of neurons with memory which are driven by the input data. Different matrices yield models that utilise different temporal relations in the data. For each experiment, a random matrix A is generated with fixed reservoir connectivity (RC) and scaled to maintain a fixed spectral radius (SR), ensuring the stability of reservoir dynamics for the majority of artificial neurons. Similarly, the input layer is sparsely connected to the neurons with a certain input connectivity (IC), and the reservoir is driven by the data multiplied by some input scaling (IS). This neural network is driven by the input system for the duration of the available data and learns