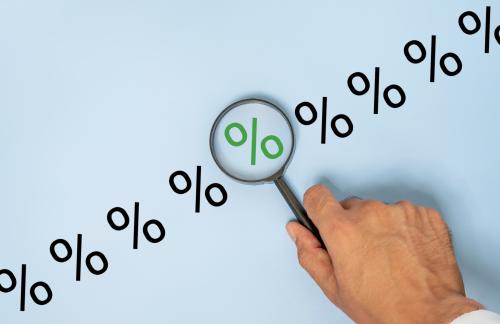
The neutral rate of interest, often referred to as r*, has been a central concept in macroeconomic analysis for decades. It represents the theoretical interest rate at which the economy operates at full capacity, with stable inflation and employment. Over the past 50 years, r* has trended downward significantly, falling from an estimated 5% in the 1970s to around 0.6% today. This prolonged decline was influenced by structural factors such as slowing productivity growth, aging populations, and increased precautionary saving. As people live longer, households have saved more for extended retirement periods, boosting the supply of capital while demand for investment weakened due to sluggish economic expansion.
However, recent developments suggest this decades-long trend may be reversing. Long-term real interest rates, which hit historic lows just before the pandemic, have risen alongside short-term rates as central banks responded to inflation. This shift has prompted economists to reconsider whether r* might now be on an upward trajectory. In a new study titled “What Next for r*?”, Lukasz Rachel of University College London examines potential drivers that could push the neutral rate higher.
One key factor is rising government debt. As public debt-to-GDP ratios in advanced economies climbed from under 30% to nearly 90%, the increased issuance of government bonds absorbed private savings and exerted upward pressure on interest rates. The model used in the paper estimates that each one-percentage-point rise in the debt-to-GDP ratio lifts r* by one to two basis points. Although the sensitivity of interest rates to debt has diminished over time—due to stronger private-sector saving—the cumulative effect remains significant, especially under scenarios of rapidly growing fiscal deficits.
Another potential catalyst is the emergence of transformative technologies like artificial intelligence. AI could boost productivity and economic growth, increasing firms’ demand for capital. If AI-driven efficiency gains materialize, they could raise the return on investment and shift the balance between saving and investment. The analysis suggests AI alone could elevate r* by approximately one percentage point, reflecting heightened capital demand from innovation leaders who are best positioned to leverage data and computing resources.
Additionally, shifts in investor preferences may be playing a role. Over the past few decades, the gap between safe assets (like government bonds) and riskier investments has widened, with safe rates falling more sharply. This ‘safety premium’ may now be narrowing, as inflation volatility and fiscal concerns make government debt appear less secure. If investors demand higher returns for holding sovereign debt, this repricing could quickly lift r*.
While uncertainty remains about the precise level of r*, there is broad consensus among models that the long-term decline has occurred. The current debate centers on whether recent market movements reflect a structural turning point. Although pinpointing r* is inherently difficult due to constant economic shocks, structural modeling offers a framework for evaluating plausible future paths. Ultimately, the implications of a rising r* are complex: higher rates could ease constraints on monetary policy during downturns but also increase borrowing costs for governments and firms.
— news from Brookings
— News Original —
Is the neutral rate of interest going to start climbing after years of decline?
[music] n nEBERLY: I am Jan Eberly, the James R. and Helen D. Russell Professor of Finance at Northwestern University. n nSTEINNSON: And I’m Jón Steinsson, Marek Professor of Public Policy and Economics at the University of California Berkeley. n nEBERLY: We are the co-editors of the Brookings Papers on Economic Activity, a semi-annual academic conference and journal that pairs rigorous research with real-time policy analysis to address the most urgent economic challenges of the day. n nSTEINNSON: And this is the Brookings Podcast on Economic Activity, where we share conversations with leading economists on the research they do and how it will affect economic policy. n nr*, the so-called natural rate of interest, has emerged over the past few decades as one of the most important concepts in macroeconomics. r* is roughly the interest rate that would prevail in an economy operating at full steam with a stable employment rate and a stable rate of inflation. n nInterest rates were unusually low for a long period between 2008 and 2022. This led researchers and central banks to revise downward their estimates of r*. In a new paper titled “What Next for r*,” Lukasz Rachel presents new estimates of the evolution of r* over the past 50 years and asks whether recent developments might result in this being a turning point for r*. n nEBERLY: This paper is very ambitious in trying to understand long run trends that have apparently taken r* on a declining path for almost 50 years. Lukasz then asks whether, taking into account the expected sources and uses of capital in large developed economies, that era may be coming to an end. For example, as demographics change and households age, will the supply of capital from household savings rise and maintain a low cost of funds and r*? n nOr on the contrary, perhaps demand for capital investment will rise as AI takes off or as government budget deficits may further increase, increasing the demand for capital and pushing up interest rates. Lukasz tries to balance all of these forces and examine scenarios for the future of r*. n nSTEINSSON: Today’s discussion will be led by Wendy Edelberg, Senior Fellow in the Brookings Economic Studies Program, who will be joined by the author of this study, Lukasz Rachel, assistant professor at the Department of Economics at the University College London. n nLet’s turn it over to Wendy. n nEDELBERG: Thanks, Jan and Jón, and I am delighted to be here with Lukasz to discuss this really interesting paper jam packed with insights. And the first question is gonna be the most obvious one. What is r*? And why should anyone care about it? n n[3:05] n nRACHEL: Thank you, Wendy. It’s great to be here with you to discuss this paper. n nYeah, so this paper is about r*. r*, also known as a natural or a neutral rate of interest, is basically an anchor towards which the interest rate in an economy that’s operating at potential – so with full employment and with contained inflation that’s on the central bank’s target – is going to converge to. So, what we think about what the federal funds rate is today, we can think also going forward, once today’s shocks are going to be in the rear view mirror, where are interest rates likely to settle. n nThat is an interesting concept for a range of people in the economy. So, starting with the central bankers and people working at the Treasury. For these people, for policy makers, knowing this anchor to interest rates is of course a vital importance. To the central bankers, it tells them where the neutral stance of policy is, and so it provides this benchmark against which to tighten or to loosen policy. So to the fiscal policymaker, it tells them about the cost of financing government debt over the longer term, and so determines naturally the fiscal sustainability type of issues and what the country cannot afford. n nBut it has broader significance for a range of actors operating in the economy. So of course, for households, that’s a big financial decisions that people make in life rely on interest rates. So, when you’re getting a mortgage or when you’re planning to put some money towards retirement, you want to think about what average returns or what average cost of a mortgage you’re going to face, and thinking about r* gives you a sense of that is. Similarly for firms, they want to know what the cost of capital is to make the right investments. They want to know what the borrow costs might be going forward. n nSo it’s a concept that’s definitely useful for both economists, but also the non economists. n nEDELBERG: So for our listeners, you should imagine when we say r*, like R, with a little asterisk, you know, in the upper right hand corner of that R. It’s not something that we can observe. You can’t open the newspaper and see what r* is. So, it has to be estimated. And your paper says r* was around 5% in the 1970s, and then is perhaps 0.6% today. n nThat’s a huge change, and your paper walks through what the primary reasons are, so walk us through that. n n[5:26] n nRACHEL: So r* is usually presented in real terms, so after accounting for expected inflation. So one thing to bear in mind is any quantities that we talk about in real terms, so if you want to get nominal interest rates, you should add back 2% or so for the expected inflation if inflation is on target. n nNow, you’re absolutely correct that the exercise in the paper that I present shows r* declining by several hundred basis points, so from about 5% in the 1970s to close to zero today, although there are some risks scenarios that are also analyzed in the paper that will come onto talk about later. n nBut in terms of the historical developments, the paper is not the first study that points to this decline, but the paper really zooms in on that decline and tries to decompose it into the various drivers. n nBasically, the way I think about how r* is determined in the economy is through the capital markets equilibrium. So, to put it perhaps more simply, it’s determined through the balance of saving and investment. Households saved for various reasons, for precautionary reasons, for retirement, and so they have some resources that they want to keep for future use, basically. n nOn the other side of this equilibrium were firms and government that make use of these funds to fund capital investments or social spending. And then the general equilibrium model that asks at what rate of interest are the desire to save is broadly balanced with the desire to invest and that is going to be basically how natural interest rate is determined. n nAnd so when we think about what actually happened over the past five decades, what I uncover in the paper is a massive shift in the desire to save that is driven by a range of reasons, but some of the most important ones are the demographic factors, the fact that an average worker back in the 1970 was expecting to be retired for about seven years, and an average worker today or in a few years’ time will be expecting a retirement period of more than 20 years. So, a really dramatic change in life expectancy that has driven this big change in how much time people spend in retirement and therefore how much money they want to put aside to cover the expenses during the retirement. n nThe other factor that is very important is the change in the expected growth rate of the economy, and that is driven both by the changes in the productivity growth and also changes in population growth. Both of these quantities have declined, so the advanced economies tended to grow faster 50 years ago than in more recent data, and the slower growth in the economy, again, makes the future a little bit more bleak in relative terms and encourages saving and discourages investment. And again, that changes this balance between saving an investment, pulling down on the interest rate. n nYou mentioned 5% back in the seventies and more recently, close to zero is actually even more dramatic than that because as I show in the paper, it’s likely that r* has increased in the meantime at the beginning of the samples in the late seventies and beginning of the eighties, as the growth expectations were really rather high back then. They didn’t really pan out and so since the early eighties, we’ve observed this continued decline. n nLet me also highlight here perhaps that this is a very interesting time to be thinking about these questions because this long run decline, basically 35-40 year decline in long-term real interest rates that we observe in the markets, have come to an end recently. So, the interest rates were their minimum just before the pandemic and the pandemic came about. There was a bout of inflation. Central banks were fighting inflation by hiking short-term policy rates but long-term interest rates have increased by almost as much as the short-term interest rates, and so that really motivates me writing this paper. n nIt motivates the asking the question of whether this is a turning point or we are going to be stuck in this business as usual scenario that’s dominated the narrative before COVID and that basically well described this period of continually declining and low interest rates. n nEDELBERG: So, someone out there listening to us is going to draw the connection between rising interest rates and the dramatic increase in federal borrowing over the past few years, and your paper explores this connection. n nHow much do you estimate federal borrowing pushes up the natural rate? n n[9:44] n nRACHEL: So that’s a very interesting and policy relevant question because as you highlighted, the fiscal outlook in the United States, but also in many advanced economies, it’s fairly uncertain and some of the projections for government debt going forward are pretty worrying. n nSo, government debt plays an important role because by issuing debt, government basically floods the market with an additional asset, and through that affects this capital market equilibrium. The rise in government debt-to-GDP ratios across advanced economies historically has been one of the most important counterweight to some of these private sector forces like growth, like demographics, that I have talked about just a moment ago. n nAnd so over time, the government debt-to-GDP ratio in advanced economies that I consider in the paper increased from less than 30% of GDP to just about 90% of GDP. So that is a big change and that has provided a big boost to interest rates. In other words, interest rates would’ve been even lower had the government debt-to-GDP ratios not increased. n nNow in terms of specifics of your question, I think it is useful to provide this sort of multipliers of what model predicts a change in government debt-to-GDP ratio does to interest rates, and that is something in the region of one percentage points of debt-to-GDP ratio increase raises r* by between one and two basis points. So that is the sensitivity. n nThe model also has some value in telling us how the sensitivity has changed over time. And what I find is actually that this sensitivity has gone down over time as the private sector forces that we discussed, the demographics, the slow down in growth, these forces make it basically easier for the economy to absorb larger increases in debt, resulting in a smaller sensitivity of interest rate-to-debt. n nBut that sensitivity is still substantial and so in the context of these fiscal scenarios where the debt trajectory is fast increasing, the model paints a cautionary tale in terms of government finances, because of course, the higher is the debt, the more problematic is the fiscal outlook, and on top of that, this mechanism predicts that interest rates are going to be rising further adding to the fiscal woes. n nEDELBERG: So I wanna make sure that I have a rough sense of the numbers. So, the increase in debt-to-GDP from 30% to about 90% would mean an increase in r* in the ballpark of one percentage point? n nRACHEL: That’s correct. n nEDELBERG: Okay. Now, you also mentioned that when the government’s borrowing, it’s actually putting assets out into the world. Those assets are in wealth, and I’m going to then use this as a transition to talk about the relationship between r* and the wealth-to-GDP ratio. It’s a super interesting and subtle part of the paper. n nTell us about the relationship between the factors that affect r* and affect wealth-to-GDP. How do those two things work together in your model and maybe even in the world? n n[12:46] n nRACHEL: Of course. So, the capital markets equilibrium that I started off with is precisely the lens through which we can think about these two important variables jointly. We discussed the trends in long-term real interest rates and what the model in my paper predicts has happened to r*, the neutral real rate. n nBut equally interesting are the developments that happened to wealth, or wealth-to-income ratio in advanced economies, and basically across the advanced economy block the wealth-to-income ratio over the past 40 years has doubled from about three times annual GDP to six or six and a half times annual GDP. n nSo, we have observed a really big increase in wealth relative to income. And the paper offers a framework which can be used or is useful for thinking about these trends jointly. Now I think the best way of using this framework is to think about the more primitive drivers of behavior, so changes like demographics or changes in taxation, market power, government policy in terms of debt issuance or social security spending, and then thinking about how these changes shift the desire to save versus the asset absorption in the economy, and figuring out what combinations of the interest rate and the quantity of wealth correspond to these shifts. n nEDELBERG: So, one of the more counterintuitive results in the paper, at least to me, was your finding that a decline in productivity growth over time has actually pushed up the wealth-to-income ratio. And I had a hard time wrapping my head around that. How does that come about? Why should that make sense to us? n n[14:25] n nRACHEL: That’s a great observation and that is very interesting because that result lies at the core of the general equilibrium mechanisms of the model. n nSo of course, the partial equilibrium intuition is that a lower rate of growth will mean that companies will grow more slowly. They will generate, all else equal, less profits, and so that would tend to depress asset values and depress wealth-to-income ratio. n nBut in general equilibrium, we have to ask, how does this change in the growth of the economy translate into changes in the steady state or mutual real interest rates? And in a calibrated version of a macro model, it is perfectly plausible that the interest rate change will be quite large relative to the change in growth. And this is precisely what happens in the model of my paper. n nA one percentage point decline in growth results in more than one percentage point decline in r*, the sensitivity is about one and a half, so I think about one and half percentage point decline in the long-term real interest rate. And because the cash flows that companies generate over the future are discounted by the natural rate of interest or discounted by the discount factor that is closely related to the natural rate of interest, then that effect can actually dominate. n nThis is indeed what I find that the lower rate of growth delivers lower interest rate, but through that dominant channel, it also generates an increase in wealth-to-income ratio. So that is very much a general equilibrium intuition where we have to take into account the impact going from the growth rate of the economy through the discount rate onto the wealth to income ratio. n nEDELBERG: So should we think of, like, is a high r*, good or bad? I mean, it feels like a high r* should be bad because that is maybe being pushed up by higher federal borrowing. It means that a company has a higher cost of capital. We look to monetary policy to lower interest rates when we want them to spur more economic growth. n nSo, all those things go in the direction of higher r* bad, lower r* good. But I know it’s more complicated than that. So, tell me why that intuition is wrong. n n[16:47] n nRACHEL: Sure. So perhaps let me start at the individual level. You know, if you’re listening to this podcast and you’re thinking, you know, should I cheer for low or high r*?The answer is, it depends. It depends on the stage of your life, and it depends on what you’re likely to do in the future with your financial situation, with your financial position. If you’re a prospective borrower, then a low r* should be good for you. That will mean cheaper cost of borrowing, whereas if you are on net a person who’s already saving perhaps for retirement, then low r* might bring about low returns, and perhaps you need to save even more to accumulate the desired level of wealth. n nSo, at the individual level, it very much depends. At the level of the macro economy, it also depends to an extent because different drivers can deliver different combinations of r*, and so of course a high r* will be a rather desirable outcome if the economy is about to grow a lot and if the high r* is driven by high growth expectations, it might be a bit more concerning if the high r* is there because of high government indebtedness and the fiscal concerns. n nThere’s one other point that is definitely worth mentioning, which is that neutral real rate is an anchor to the monetary policy rate, and monetary policy faces a natural constraint of the effective lower bound. So, with very low steady state interest rates, it is more likely that the central bank would find itself close to the effective lower bound more often than otherwise, and that might constrain the ability of monetary policy to effectively manage the cycle. And so, from a cyclical management point of view, we tend to think that higher interest rates are perhaps safer because they keep us away from that zero lower bound. n nBut they’re also relatively new ideas, new theories about how high or low interest rates affect a longer term performance of the economies with this double feedback loop. So, there are recent papers that point out that perhaps with low interest rates there’s less innovation in the economy as the dominant players incumbents in the market have an easier time basically dominating the market. And it might be harder for smaller and more innovative firms to break through and enter the market, so that’s another reason why low r* might be somewhat problematic. n nBut going back to the beginning, you know, I think it really does depend, and so, the normative implications are quite complex. n nEDELBERG: Let’s talk a little more about the relationship between r* and wherever monetary policy makers are trying to set interest rates. n nAt the BPEA Conference, and if listeners haven’t watched that, I highly encourage you to go and watch Lucasz’s presentation and the discussion afterwards, it was fantastic. As part of that discussion, there was a lot of focus on the uncertainty around r*, and some questioners were suggesting that that uncertainty spanned many percentage points, and I was wondering how much the stance of monetary policy can help pin down where r* is. n nAnd what I mean by that is, if monetary policy makers think that r* is, let’s say, half a percentage point, and they try to set interest rates, let’s say a percentage point above that because they are trying to make monetary policy be somewhat tight, and it turns out they’re just wildly wrong, and r* is in fact 3%. Then that would mean that they tried to get monetary policy to be somewhat tight, and it turns out that the stance of monetary policy is incredibly accommodative. n nAnd you know, I can walk through that exact same example, but on the in the mirror image where they get r* wrong and it means that monetary policy is much too tight and they thought that they were trying to have accommodative monetary policy. Those two worlds have really different outcomes for inflation, for what’s happening with aggregate demand. n nAnd so, should I think that the fact that monetary policy does what it does, and we see what the resulting effects are on inflation and spending, does that help us pin down what r* actually is and reduce some of our uncertainty? n n[21:05] n nRACHEL: Thanks for this question. You just beautifully described the intuition behind an econometric approach to estimating r*. At least a subset of these approaches relies exactly on this intuition that this is a concept that we cannot observe, but we can tell what r* is if we observe what is happening in the economy. And conceptually that has led to many, many papers that are based on that intuition, and that is surely one of the right approaches of thinking about r*. n nThe practical difficulty that comes together with this approach is that the economy is constantly being hit by various shocks. Demand, supply, political shocks, various events arrive, and so what we as econometricians or economists need to do is disentangle these shorter term shocks and influences from these mechanisms that we have just described so that the actual interest rate is above or below r*, the economy should behave in a particular way. And when we do this in a rigorous way, when we actually write down econometric models and try to estimate them, it turns out that distinguishing this noise from signal, it is quite a daunting task. And we do get, therefore, quite wide uncertainty bounds around these estimates of r* that results from these methods. n nNow my approach in this particular paper is different. It is to write down a structural model of the economy, calibrate it, and basically think about what the theory tells me about r*, and of course, the model is then tested against the data in the sense that it’s particular predictions at the both micro and macro level can be compared to the empirical evidence. Basically, check on whether the model makes sense along the dimensions that we can check the model against. And then, to the extent that it does, maybe it gives us good confidence that it also predicts these unobservable dimensions like the r* reasonably well. n nBut of course, as you mentioned, the uncertainty around this concept is substantial, so we should always have enough humility and take any point estimates with a substantial grain of salt. But I think more important than any specific point estimates are the internal consistency that this model brings to the table. n nSpecifically, I can think about scenario analysis or testing the internal consistency of my hypothesis or of my views in this economic laboratory that the model is. So, I think that’s the main use of this tool that I find most compelling n nEDELBERG: And it’s very good, then, at pinning down that as uncertain as we are about the level of r*, you’re a lot less uncertain about the fact that r* has fallen over time. Is that right? n n[23:52] n nRACHEL: Yes, I think that’s right. There’s plenty of evidence, both in terms of econometric estimates, financial market based estimates of r*, and also the theoretical mechanism that I think give me a reasonably large confidence in this decline in r*. And I think as a profession, we have arrived at setting the framework in such a way that we can compare against the different models and that comparison delivers a pretty unanimous answer on what has been happening over the past 40 to 50 years. n nThe precise level is a bit harder to pin down, that is true, but I think we can get closer by analyzing not just one model, but thinking about the different models and think about exactly where the differences are coming from. n nThinking about that is very useful, but that shouldn’t cloud the big picture that these models are in fact largely consistent with each other in terms of centrally qualitative and but also quantitative predictions in terms of specific drivers and the overall decline in r*. n nEDELBERG: Let’s use our last couple of minutes to talk about the future. n nYou test six scenarios in the paper to think about where r* could go, and under those six scenarios, what could drive r* back up. So, talk a little bit about that and explain what the future’s gonna look like. n nThat was a joke. I appreciate that the future’s very uncertain. n n[25:13] n nRACHEL: No, of course. n nRight so, let me go back to the beginning of our conversation and remind you that there has been this 40-year decline in r* and the recent pickup in longer term real government bond yield, certainly, and long-term interest rates that we observed in the market. n nAnd so there’s a question of whether the market is suddenly signaling to us that interest rates might be higher for longer. And there’s plenty of narrative out there, plenty of explanations for why that might be the case that have appeared on our horizon more or less in the last few years and haven’t been there before. These are things like the rise of generative artificial intelligence, the rise in military conflict around the world, or the concerns about the future of globalization. n nAnd so what I do in that last part of the paper is basically contrast what I call a business as usual scenario, which basically projects r* as if before the pandemic, before all of these substantial changes and shocks have happened, to the scenarios of r* under a pretty bold forecast for some of these variables. n nSo, as you mentioned, I consider six scenarios and perhaps let me just pick on a couple here. So, one scenario that I consider is the rise of artificial intelligence. What does artificial intelligence do in the context of a macro economy? Well, it’s likely that AI is going to make us more productive and perhaps is going to boost growth for some time to come. And there’s some guesstimate out there that we can use to try to calibrate this increase in economic efficiency. n nBut AI is also likely to benefit the biggest players the most because these firms have greatest access to data and perhaps have the resources to use this data more efficiently. And so perhaps we’re going to observe a more concentrated markets because of AI. n nAnd the final thing that it might do is it might lead to automation of some tasks, same as some previous past automation technologies have tended to shift some tasks away from human labor and towards machines. AI might do the same thing. n nSo, I combine these three different impacts of AI in this scenario analysis to then develop a scenario for AI and then think about how r* is affected in that particular scenario. Once I put numbers on these three things, I get that AI can easily boost r* by perhaps one percentage point. n nAnd so, one interpretation of what we have seen in the markets in the recent years is that the markets are already pricing in some of that AI boom. n nBut of course that’s not the only interpretation. The markets could be pricing some other story. And so, I consider five other stories. Perhaps let me pick on one more story that I think is quantitatively important, but it’s also interesting and perhaps slightly uncomfortable, and that’s the story about the safety premium. n nOver the past three decades or so, the safe real interest rates have declined by more than the risky rates, the rates of return on productive capital, which has its own credit and other risks. And that widening of the spread between what we call the safe rate of return and the risky rate of return might unwind over time for several reasons. n nWe already talked about the relatively risky concerning fiscal situation, but having just gone through quite a large inflation shock, the investors might be a bit wary of lending cheaply to the governments and buying their nominal government debt. And so that’s another reason why this spread between safe and risky rates might close, perhaps not fully, but this increase in the spread might unwind somewhat. n nAnd I find in my paper that this tightening of this spread between safe and risky rates is impacting primarily on r*, on the safe rate of return in steady state, close to one to one, meaning that any closing of this spread will show up as the higher r*, and that can happen fairly quickly. And so that’s another interpretation perhaps of what we have seen in the markets. n nPerhaps the markets are slightly less perceiving the safe assets, what is called an economic safe assets, safe from credit risk of course, not from other risks, but perhaps the markets are perceiving the safe assets as slightly less safe, which in and of itself would lead to a rise in r*. So that’s another scenario which has a quantitative bite and which can erase our stuff pretty quickly, so it can come pretty suddenly. n nAnd the reason why this leaves me a little bit uncomfortable is that I think we don’t have a very good explanation for the movements in this spread. There’s many hypothesis out there and many models, but I think there’s no silver bullet in terms of really understanding that spread. And so, my model highlights that it’s important. It doesn’t in and of itself provide a good explanation for what drives that spread. n nAnd so I think that’s a very interesting area of further work. n nEDELBERG: Because that spread has changed a lot over time, right? It’s not like it’s been constant and so it’s hard to grapple with why has it changed so much over this past 40-year period, for example. n n[30:10] n nRACHEL: No, that’s right. I mean, part of the reason why the spread has changed is probably to do with international environment and the fact that a lot of the savings that are coming to advance economies from abroad, from developing markets, from China, were focused on investing in safe assets, and so there’s this extra demand for safety. There’s a large literature in economics on that channel. n nBut perhaps also there’s just more uncertainty around some of it driven by technology, some of it perhaps driven by declining importance of safety nets and so on, that drives precautionary saving, particularly in this safe assets. n nIt could also be that the aging process itself that we have talked about affects this spread as perhaps the older populations want to invest more in safe than risky assets. So, it could be a plethora of things driven by risk aversion or an appetite for safety. And precisely as you said, given that this spread has changed a lot, it doesn’t take much for some of the unwind of this spread to happen, and that has first order consequences for r* and therefore for monetary and particularly also fiscal policies. n nSo that is definitely something to watch, n nEDELBERG: So I have to let you go. This has been a great conversation. I’ve learned a lot, and thank you for writing this paper. n nRACHEL: Thank you very much. It’s been a pleasure. n n[music] n nSTEINNSON: Once again, I’m Jón Steinsson. n nEBERLY: And I’m Jan Eberly. n nSTEINNSON: And this has been the Brookings Podcast on Economic Activity. Thanks to our guests for this great conversation and be sure to subscribe to get notifications about new releases of this podcast. n nEBERLY: The Brookings Podcast on Economic Activity is produced by the Brookings Podcast Network. Learn more about this and our other podcasts at Brookings dot edu slash podcasts. Send feedback to podcasts at Brookings dot edu and find out more about the Brookings Papers on Economic Activity online at Brookings dot edu slash B-P-E-A.