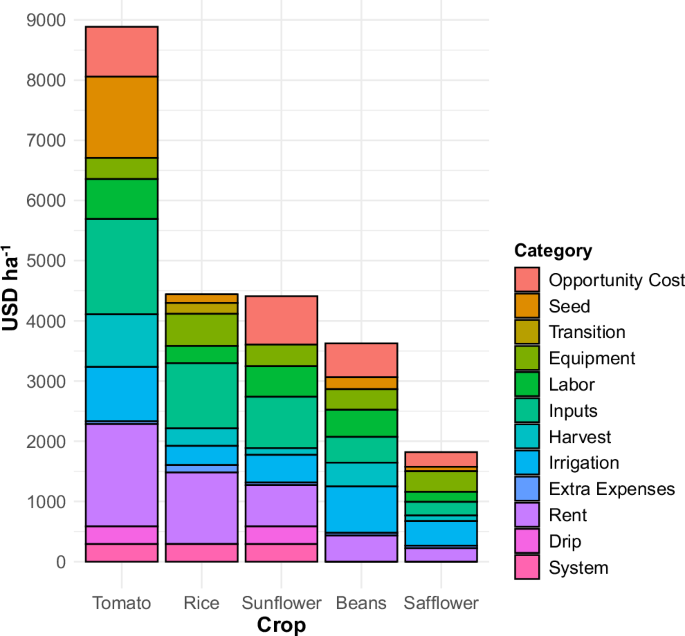
Rice (Oryza sativa L.) serves as a staple food for more than half the global population and contributes to wetland conservation. Flooded rice systems have demonstrated sustained high yields over time, unlike dryland monocultures that often degrade soil and harm the environment. However, challenges such as pest pressures, climate variability, labor shifts, and rising input costs are prompting a reevaluation of continuous rice cultivation. One strategy gaining attention is crop diversification—rotating flooded rice with non-flooded upland crops—which can improve soil health, reduce pests, and potentially enhance yields. While these agronomic advantages are recognized, the economic implications remain less understood, particularly regarding profitability and financial risk. n nCost-benefit assessments help farmers evaluate new practices by weighing upfront investments against potential returns. Transitioning from flooded rice to dryland crops involves additional expenses in equipment, land preparation, and irrigation infrastructure. Some alternative crops may yield higher revenues but demand greater capital, while others may lower production costs despite generating less income. The net financial outcome depends on how these factors interact over time. n nResearch on the economics of rice-based rotations is limited, especially in temperate regions like California, where rice is primarily grown in Arkansas, Louisiana, Texas, and California’s Sacramento Valley. In this region, over 95% of rice is cultivated under continuous flooding, using more than 1,500 mm of water annually. Less than 10% of rice fields undergo crop rotation. Recent pressures—including water shortages, herbicide-resistant weeds, and rising input prices—have reduced planted acreage and threatened farm profitability. For example, rice acreage dropped by 15–50% in recent years due to diminished surface water availability. In 2022 alone, fallowed fields led to an estimated $500 million in lost revenue, much of which was offset by crop insurance. n nThis study evaluated the financial performance and management adjustments required when shifting from continuous rice to diversified systems. Two rotation scenarios were analyzed: a high-cost, high-revenue path (rice – sunflower – tomato) and a low-cost, low-revenue alternative (rice – safflower – beans), compared to continuous rice (RRR). The analysis also considered long-term benefits such as improved rice yields and reduced herbicide use after rotation, as well as climate risks like drought-induced fallowing. The objectives were to assess (1) production costs, revenue, and profit margins for each crop relative to rice, (2) long-term profitability using probabilistic Monte Carlo simulations, and (3) how water scarcity and rotational agronomic benefits affect financial outcomes. It was hypothesized that initial investment and opportunity costs would reduce short-term profits for rotational crops, but long-term gains could outweigh these drawbacks under favorable conditions. n nSwitching from flooded rice to row crops requires significant changes in field operations. Continuous rice is typically aerially seeded into flooded fields, with minimal post-harvest labor beyond straw incorporation and winter flooding for decomposition. In contrast, rotational crops like sunflower, tomato, safflower, and beans are grown on raised beds using furrow or subsurface drip irrigation. After rice harvest, additional tillage is needed to remove levees and prepare seedbeds. Labor increases due to manual weeding, bed shaping, and irrigation maintenance. Although some operations are contracted out—reducing equipment ownership costs—labor demands rise. Tomato and sunflower require drip systems, which entail higher installation and upkeep expenses. All rotational crops involve a learning curve and market development, representing a non-financial but real economic cost known as opportunity cost. n nProduction cost analysis revealed stark differences among crops. Tomato had more than double the total costs of rice, driven by high input, labor, and rental expenses. Sunflower and beans reduced standard production costs by 14–19%, while safflower cut them by 57%. For rice, the largest expenditures were land rent (27%) and inputs (22%). Irrigation accounted for only 7% of rice costs, whereas it represented 21–22% for beans and safflower. Equipment costs were lower across all rotational crops due to reliance on contracted services. Labor costs were higher for tomato ($665 ha⁻¹), sunflower ($506 ha⁻¹), and beans ($449 ha⁻¹) compared to rice ($389 ha⁻¹). Opportunity costs—reflecting time spent learning new systems and accessing markets—were highest for sunflower (18% of total costs) and tomato ($803 ha⁻¹), though this represented a smaller share of tomato’s overall budget. n nAnnual profitability varied significantly. Without accounting for transition or capital investments, tomato yielded an average profit of $2,114 ha⁻¹, followed by sunflower ($863 ha⁻¹), rice ($252 ha⁻¹), beans ($256 ha⁻¹), and safflower ($-256 ha⁻¹). However, when including capital costs (e.g., drip irrigation at $4,375 ha⁻¹), opportunity costs, and transition expenses, only rice and tomato remained profitable. Tomato’s profit dropped to $793 ha⁻¹, sunflower turned unprofitable ($-532 ha⁻¹), and both beans and safflower recorded losses ($-286 and $-506 ha⁻¹, respectively). The financial strain stemmed from irrigation labor, market access challenges, and lower revenues, particularly for safflower and beans. n nOver a 15-year horizon, discounted annual net returns showed that continuous rice (RRR) generated a cumulative net present value (NPV) of $3,561 ha⁻¹. The rice-sunflower-tomato rotation (RSTT) reached $3,731 ha⁻¹—$170 more than RRR—but did not break even until year 12 due to high initial costs. In contrast, the rice-safflower-beans scenario (RSBB) saw its NPV fall to $1,643 ha⁻¹, less than half of RRR, due to recurring losses from safflower. When two fallow years were introduced into continuous rice (RRF) to simulate drought conditions, its NPV dropped to $2,995 ha⁻¹. Under this scenario, RSTT surpassed RRF by year 11, while RSBB remained less profitable. n nWhen agronomic benefits—such as a 10% increase in rice yields and 50% reduction in herbicide use after rotation—were factored in, both rotations outperformed continuous rice. RSTT-benefit achieved a cumulative NPV of $5,984 ha⁻¹ by year 15, exceeding RRR by $2,423, with break-even by year 10. RSBB-benefit reached $3,970 ha⁻¹, surpassing RRR by $409, with profitability emerging between years 12 and 13. When combined with drought mitigation (RRF), both rotations showed even greater advantages: RSTT-benefit exceeded RRF by $2,989 ha⁻¹, and RSBB-benefit by $975 ha⁻¹, with faster payback periods. n nRisk analysis using Monte Carlo simulations indicated that RSTT had a 55% chance of outperforming RRR and 65% over RRF. RSBB had only a 10% chance of beating RRR and 15% over RRF. With agronomic benefits included, RSBB-benefit had a 70–85% likelihood of surpassing RRR and RRF, while RSTT-benefit reached 90–95%. These results highlight that while short-term losses are common, long-term gains are probable if rotational benefits materialize. n nThe findings suggest that crop diversification can enhance economic resilience, but only under specific conditions. High-revenue crops like tomato offer strong returns but require substantial investment. Low-cost options like safflower and beans reduce expenses but struggle to generate sufficient income. The most viable path depends on a farm’s capacity to absorb early losses, access contract labor, and realize rotational benefits such as higher yields and reduced inputs. For many rice growers, the 6–12 year payback period acts as a major deterrent, especially when continuous rice remains financially stable. However, in the face of increasing water scarcity and input costs, diversified systems may become essential for long-term sustainability. n— news from Springer Nature
— News Original —
Addressing economic barriers to crop diversification in rice-based cropping systems
Rice (Oryza sativa L.) provides food for over 50% of the world’s population while conserving wetland ecosystems1. Globally, flooded rice systems have shown the potential to maintain high yields with continuous cropping over long periods of time, unlike monocropping in non-flooded soils which can lower yields, degrade soils, and contribute to environmental pollution1,2. However, there are several global pressures forcing rice systems to diversify including pest management, climate change and water scarcity, labor demand shifts, and increasing agricultural costs of production3,4. In reaction, research has focused on the implications of crop diversification in rice systems across multiple sustainability lenses5,6,7. Crop diversification with rice is defined here as rotating flooded rice with non-flooded upland cash crops, which provides several agronomic benefits such as reduced pest pressure, improved soil health indicators, and increased crop yield5,8,9. While each of these factors may increase profitability over time through a combination of reduced costs or increased revenue, the economic impacts of crop diversification remain a major knowledge gap10. n nCost-benefit analyses provide insights to help farmers make financial investments, assess risks of adopting new technologies, or quantify under what circumstances new management practices may be profitable11,12,13. Furthermore, cost-benefit analyses are important to better understand barriers to adoption by assessing how different factors impact the costs of production as well as crop yields and revenue, both of which drive profitability14,15. Switching between flooded rice to a non-flooded crop introduces additional investment, labor, and financial uncertainty for several reasons7,16. Rotation crops can produce higher returns, but may require higher costs for new equipment, land preparation, and irrigation infrastructure which may not necessarily lead to increased profits. In contrast, other crops may decrease revenue but save on production costs, increasing net gains. n nCurrent research on the economic impact of crop rotations in rice systems is sparse10,17. Some studies have taken place in tropical and sub-tropical climates, where an upland crop is planted in the fallow season or takes the place of the shorter season, secondary rice crop5,6,7,8. In temperate regions of the United States, rice is grown as a summer crop with the primary production occurring in Arkansas, Louisiana, Texas, and California. Research on crop rotations with rice in the United States often comes from a pest management perspective, such as the infestation of weedy (red) rice, or concerning the impact rice has on the non-flooded crop18,19. Less research has assessed the economic impacts of replacing summer rice with an alternative row crop, meaning less years of rice in the overall rotation. Investigating the level of farm management changes required to switch from continuous rice to a rice-based rotation including several years of rice followed by several years of a non-flooded summer crop is critical to understand long-term financial viability. n nOften economic studies in agriculture assess a single outcome without exploring how profits may change over time8,9,20,21. The sequence of different crops grown in rotation over the long-term can be modeled using Net Present Value (NPV) to determine risk and profitability of different rotation scenarios22,23. While additional costs can act as a disincentive, over time crop diversification can increase economic resilience and profit due to agronomic benefits such as higher yields14,17. However, many cost-benefit studies focus on indirect benefits such as input savings from increased soil nutrients, yet rarely do they quantify indirect costs related to farmers needing to gain knowledge and skills or build relationships to access markets24,25. n nIn the absence of experience, farmers need to sacrifice time spent learning a new system, rather than spending that time generating income elsewhere12,22,26. This indirect cost is known as the opportunity cost27. Here, the opportunity cost of these events is linked to the value farmers place on their own time, thus considering these costs can help identify additional barriers to adopting a new system. Traditional cost-benefit studies also fail to consider financial uncertainty due to variability in crop yield, operational costs on farms including irrigation and input requirements, and crop price. Sensitivity analysis can help illustrate the relative importance of different assumptions but cannot quantify the likelihood of outcomes due to economic uncertainty22. In contrast, probabilistic economic analysis, such as Monte Carlo simulations, can be a way to assess the risk of financial decisions by providing a distribution of possible outcomes based on many changing variables22,28,29. n nCalifornia produces rice on approximately 212,000 ha annually30, roughly 95% of which is grown in the Sacramento Valley31. California rice landscapes are dominated by continuous rice planted each summer, requiring over 1500 mm for flood irrigation, followed by a flood or dry fallow in the winter months32. Less than 10% of rice lands are under some form of crop rotation33,34. Recent challenges relating to water scarcity, herbicide resistance, and increasing input prices are threatening profitability by reducing planted area, crop yields, and increasing the costs of production34. As an example, annual rice acreage has declined by 15–50% in recent years, mostly due to reductions in surface water availability30. During 2022, the extent of fallowed rice fields corresponded to a revenue loss of about $500 million, much of which was covered by crop insurance35. Recent interviews with farmers suggest that rotations can increase profitability by diversifying the portfolio of crops grown, while decreasing input costs in rice for weed control and increasing rice yields34. However, other farmers questioned the feasibility of rotations due to high clay soils and lack of equipment and markets. n nIn this study we assessed the economic performance and required changes in management for crop diversification in flooded rice systems. Crop rotation scenarios represented (i) high costs and revenue (rice – sunflower – tomato) and (ii) low costs and revenue (rice – safflower – beans), as compared with continuous rice. Furthermore, we included two scenarios that incorporated agronomic benefits of rotations and the ability to adapt to climate risks such as increasing water scarcity, considering recent trends where rice acreage has substantially decreased in drought years. The objectives were to determine: (1) costs of production, revenue, and profit ranges of individual crops compared to rice, (2) long-term profitability of crop rotations based on probabilistic Monte Carlo simulations, and (3) explore how rotation scenarios reflecting increasing water scarcity (represented in the form of fallowing events in continuous rice) and farmer-reported agronomic benefits of rotation such as input savings and increased rice yields influenced profitability and risk. We hypothesized that additional costs for rotational crops such as equipment, labor, irrigation investments, and opportunity costs combined with a likelihood for low revenue will negatively affect profit outcomes for rotational crops on an annual basis, but that rotations can be more profitable than continuous rice in the long-term when accounting for rotational benefits and water scarcity. n nRequired changes in management n nThe baseline system is continuous rice which is broadcast seeded with flood irrigation. Fields are leveled with a triplane and seed is flown on by airplane into standing water. After rice harvest, straw is incorporated into soil and a shallow flood is maintained over winter to promote decomposition and provide wildlife habitat. Growers deliver rice to a local elevator, so no marketing is required, allowing flexibility in rice acreage and yield levels for a given farm. All rotational crops are row crops grown on raised beds, thus focus groups reported that the biggest changes in management are related to land preparation, irrigation systems, and labor. When moving into a rotational crop following a previous rice crop, additional straw chopping and discing are required after rice harvest to minimize residues, and a winter flood is not usually done. Additional tractor work and labor are required in spring to remove levees, perform extra tillage to create a finer seedbed, and prepare beds with listing and shaping operations. Planting costs are often contracted out, increasing labor costs but decreasing equipment costs. For tomato, sunflower, and beans, contract labor is required for in-season weed control (manual hoeing). Furrow irrigation is used for safflower and beans, and sub-surface drip irrigation is used for tomato and sunflower. Despite lower water inputs compared to rice, furrow and drip irrigation systems have additional labor and investment costs. All four crops have opportunity costs related to the time it takes farmers to learn the new system and find new markets. n nRelative production costs n nTomato had more than double the total production costs compared to rice, regardless of whether capital costs, opportunity costs, investment and transition costs were included (Tables 1–3, Fig. 2). Meanwhile, sunflower and beans reduced normal production costs by 14-19%, whereas safflower reduced costs by 57% (Tables 1 and 2). Opportunity costs and labor costs were highest for tomato and sunflower, and seed costs and rent were highest for tomatoes. Yet, because tomato and sunflower had higher total costs, the relative impact of these categories in annual crop budgets was diminished. For rice, the largest costs were land rent and inputs which consisted of 27 and 22% of total costs, respectively (Fig. 1, Table 1). Rice irrigation was only 7% of total costs. Rice equipment costs were 12%, while labor costs were only 9% and transitional costs 4% of total costs. Tomato was the only crop with higher input costs compared to rice, although inputs comprised a smaller fraction of total costs for tomato (18%). Input costs were lower for all other crops and comprised a lower fraction of total costs (19, 12, and 13% for sunflower, beans, and safflower, respectively). Similarly, tomatoes were the only crop with higher rent compared to rice. For all other crops, rent was lower than rice and a smaller fraction of total costs. Irrigation costs for tomato and sunflowers were 10% but increased to 21-22% of total costs for beans and safflower. n nThe total investment for an irrigation system is estimated at $4375 ha−1, including the pump filter main line, and installment and material (Supplementary Table 10). Drip line total investment is estimated at $875 ha−1, or $290 ha−1 for each year. For tomatoes, the irrigation system and drip line were only 3% of total costs each year. Sunflower also shared the costs for the irrigation system and drip line, which represented 7% of total costs (Table 1). Equipment costs were less for all crops compared to rice, due to the assumption of contracting out field operations for rotation crops if rice equipment could not be repurposed for the job. Equipment costs for sunflower and tomatoes were 8 and 4% of total costs, respectively. For both beans and safflower, equipment represented 9 and 19% of total costs, respectively (Table 1). Compared to rice, labor costs were higher for tomatoes, sunflower, and beans. At the same time, sunflowers in California are grown for seed and marketed through contracts with seed companies, who often will be responsible for sharing certain labor costs36. Labor for safflower was the lowest at only $166 ha-1 or 9% of total costs. Finally, opportunity cost was 18% for sunflower, 16% for beans, 14% for safflower, and 9% for tomato (Table 1). n nAnnual profitability with and without capital costs, opportunity costs and costs for transitioning in and out of rice n nAverage rice profits, revenue, and costs came to $252 ha-1, $4491 ha-1, and $4485 ha-1, respectively (Fig. 2A, Table 2). The Monte Carlo distribution suggested that roughly half the time (quartile ranges) profits for rice ranged between $-61 ha-1 and $246 ha-1, depending on the combination of costs, yield, and rice price, with revenue ranging between $4171 ha-1 and $4478 ha-1 (Supplementary Table 11). When ranking the profit of rotational crops compared to rice (without investment costs), the order of most profitable to least profitable was tomato > sunflower > rice > beans > safflower (Fig. 2). Excluding capital costs and opportunity costs, profits for tomato averaged $2,114 ha-1 with a quartile range between $1350 ha-1 and $1962 ha-1 (Fig. 2, Table 1). Sunflower profit came to $863 ha-1 with a quartile range between $558 ha-1 and $862 ha-1. Average profits for beans and safflower were $256 ha-1 and $-256 ha-1 respectively, with quartile ranges between $-38 ha-1 and $188 ha-1 for beans, and $-364 ha-1 and $-263 ha-1 for Safflower (Fig. 2A, Table 2). n nWhen adding investment costs, which included capital costs, opportunity costs, and transitional costs for switching from rice to a rotation crop and vice versa, results changed substantially, with only rice and tomato remaining profitable. Profit for rice decreased to $100 ha-1 with roughly half of simulations falling between $322 ha-1 and $9 ha-1 (Supplementary Table 7). The order of most profitable crops also changed, with tomato > rice > beans > safflower > sunflower (Fig. 2B). Sunflower was impacted the most by extra costs, reducing average profit to $-532 ha-1 (quartile range between $879 ha-1 and $537 ha-1) (Supplementary Table 7). For sunflowers, the extra $1,402 ha-1 in investment costs increased total costs to $4413 ha-1. Tomato profit dropped to $793 ha-1 (quartile ranges between $14 ha-1 and $662 ha-1) with costs increasing by $1370 ha-1 (Table 3). Profit for beans came to $ -286 ha-1 (quartile ranges $-581 ha-1 and $-351 ha-1) with costs increasing by $562 ha-1. Safflower average profit came to $-506 ha-1 (range $-632 ha-1 and $-518 ha-1) with costs increasing by $250 ha-1. The negative profits frequently observed for safflower and beans without extra costs, and safflower, beans, and sunflower with extra costs are driven by irrigation (water and labor) for all rotation crops and high labor for sunflower and beans. These cost components, combined with lower revenue than rice, especially safflower and beans (Table 1, Fig. 2), influence the likelihood of experiencing negative profit. n nLong-term profitability of rotation scenarios n nFirst, discounted annual net returns (DANR) for RRR (continuous rice) was compared to RSTT (sunflower and tomato rotation without benefits) and RSBB (safflower and beans without benefits) over 15 years (Fig. 3). With consistent profits each year for rice, DANR for RRR was stable and positive over the 15-year period. In contrast, RSTT showed a substantial drop in DANR due to investment in sub-surface drip irrigation and opportunity costs during year 2 ($ -5062 ha-1) (Fig. 3). Similarly, DANR in RSBB decreased until year 4 due to opportunity costs for safflower and beans, and then again during years 8-10 during the second cycle of rotational crops (Fig. 3). n nThe cumulative NPV for RRR was $3561 ha-1 over 15 years (Fig. 4A, Supplementary Table 13). In RSTT, both tomato and sunflower had higher profits than rice, and therefore this rotation became $170 ha-1 more profitable than RRR after two rotation cycles, leading to a cumulative NPV of $3731 ha-1 (Fig. 4A). However, due to high investment costs, the break-even point for profitability with RSTT was not achieved until year 12 (Fig. 4A). In RSBB, although beans were as profitable as rice in individual years (Fig. 2A), safflower generated a loss of $-256 ha-1 each year it was grown, or $-500 ha-1 when accounting for opportunity costs (Table 2). Therefore, the combination of added opportunity costs in years 2–4 for RSBB (Fig. 3) and economic losses with safflower decreased its cumulative NPV by more than half compared to continuous rice ($1643 ha-1) (Fig. 4A, Supplementary Table 13). n nWhen two years of fallowing was introduced into continuous rice (RRF) to account for climate risks causing water shortages (Fig. 4B), cumulative NPV decreased to $2995 ha-1 (Supplementary Table 13), representing a loss of $566 ha-1 over 15 years compared to RRR. With the added two years of fallowing in the baseline continuous rice system, RSTT became as or more profitable than RRF by year 11, but RSBB still remained less profitable. n nWhen the anticipated agronomic benefits of crop rotation (10% increase in rice yields in the first two years returning to rice along with a 50% decrease in herbicide inputs) were incorporated into scenarios, both crop rotations (RSTT-benefit and RSBB-benefit) became more profitable than RRR over 15 years (Fig. 4C). The cumulative NPV of RSTT-benefit increased to $5984 ha-1 by year 15 (Supplementary Table 13), exceeding RRR by $2423 ha-1, with the break-even point for profitability achieved in year 10. Meanwhile, RSBB-benefit had a cumulative NPV of $3970 ha-1 (Supplementary Table 13), exceeding RRR by about $400 ha-1, with higher profits achieved between years 12 and 13. When the combined benefits of rotation for higher crop productivity and climate risk mitigation were included (Fig. 4D), both rotations further increased cumulative NPV while decreasing the break-even point for profitability compared to RRF. For RSTT-benefit, cumulative NPV was $2,989 ha-1 greater than RRF with higher profitability achieved between years 9 and 10. For RSBB-benefit, cumulative NPV was $975 ha-1 greater than RRF with higher profitability achieved between years 6 and 7. n nRisk assessment compared to continuous rice n nCumulative probability distributions provided evidence that 50% of the time NPV was at or above $3561 ha-1 and $2995 ha-1 for RRR and RRF, respectively (Fig. 5) after 15 years. The likelihood of being at or above these thresholds differed for the other rotation scenarios. Based on the Monte Carlo simulations, there was a 15% likelihood for RSBB to produce a NPV above RRF and about a 10% likelihood for it to produce a NPV above RRR. In contrast, RSTT showed a 65% chance of being more profitable than RRF and a 55% chance of being more profitable than RRR. When including the agronomic and climate risk mitigation benefits of rotation, the probability of RSBB-benefit having a higher NPV was 80-85% compared to RRF and 70% compared to RRR. Similarly, the probability of RSTT-benefit having a higher NPV was 95% compared to RRF and 90% compared to RRR. n nThere is great interest in diversifying monoculture grain production systems to decrease environmental footprint, respond to climate change, and enhance economic opportunities for farmers4,9,17. Our results provide a better understanding of the major changes in management and associated costs, as well as revenue and profitability ranges, for switching from continuous flooded rice to tomato, sunflower, safflower, and beans to explore options for rice-based rotations in California. Rice on its own had relatively high costs of production, but also higher revenue compared to the other crops except tomato, leading to stable profits (Table 2). Most farmers in this region specialize in continuous rice, meaning land preparation and crop management remain relatively similar year-to-year across large-scale operations, helping achieve economies of scale which is a major feature of simplified agricultural landscapes37. Approximately 1100 rice farms generate over $500 million of annual farmgate revenue, but larger farms over 200 ha-1 in size account for 72% of total harvested area and rice sales despite representing only 37% of farming operations30. n nThis research demonstrates that negative profits (relative to rice) are influenced by both revenue as well as cost savings, depending on the crop. While tomatoes had the highest costs of production, particularly with inputs, rent and custom seedling propagation (seed) (Fig. 1), they are still more profitable than rice on an annual basis (Fig. 2A, Table 2), suggesting the influence of high revenue outweighs any potential impact of costs. However, sunflower and beans show the highest sensitivity to fluctuation between being profitable and unprofitable when accounting for changes in costs (i.e., comparing outcomes for Tables 2 and 3). When adding in extra costs such as opportunity costs and capital costs, sunflower, originally 3.4 times more profitable than rice in Table 2, shifts to $-532 ha-1 in Table 3. Similarly, beans have the potential to become similar or more profitable than rice due to additional cost savings in the categories of irrigation or opportunity costs (Fig. 1, Table 1), however negative profits of $-286 ha-1 are likely to occur when capital and opportunity costs are included (Table 3). Therefore, for crop diversification to provide additional economic benefits in this context, switching from continuous rice to a non-flooded crop must either substantially decrease costs of production or increase revenues, especially considering the additional management and equipment requirements and the extra time needed to learn how to grow and market a new crop. n nWe hypothesized that higher financial requirements for equipment, labor, irrigation investments, and opportunity cost would impact profitability outcomes of rotational crops. Across 11 studies, He et al.17 reported that agricultural diversification in rice systems increased both production costs and revenue by about 30%, leading to no changes in overall cost-benefit ratio. Our results were more complex, indicating the economic potential of rotational crops fell into two categories, with both higher and lower profits possible. Tomato represented an opportunity for higher revenue ($9590 ha-1) (Table 2), but required much greater investment in irrigation and labor, thereby increasing the costs of production ($8846 ha-1). Because the additional revenue more than offset the increase in costs, this high cost – high revenue approach contributed to the highest profits ($793 ha-1). Sunflower had similar revenue potential as rice but decreased costs in a normal year, helping it exceeds rice profits by $604 ha-1 when investment costs were not considered (Fig. 2, Table 2). Results for safflower and beans were the opposite. Costs of production were $875-2609 ha-1 lower than rice which can decrease risk and provide advantages in large-scale capital-intensive farming systems. However, there was little opportunity for increased revenue, which resulted in beans achieving similar profit as rice and safflower consistently decreasing profit compared to rice in normal years (Fig. 2). Importantly, when additional investment and opportunity costs were included, both safflower and beans lost money in transition years ($-286 to -506 ha-1). Thus, safflower and beans were characterized by low cost – low revenue – low profit. n nAnalyzing the required changes in management and their associated costs can provide insight into how economic factors act as a barrier to adoption for crop diversification. Labor costs were higher for tomato, sunflower, and beans ($665, $506, and $449 ha-1, respectively), relative to rice ($389 ha-1) (Fig. 1, Table 1) due to higher land preparation and manual hoe labor requirements (Supplemental Tables 6–9). An extra $182 ha-1 was required in the form of land deconstruction and field leveling when switching out of or into rice (Fig. 1, Table 1). Furthermore, irrigation labor was higher for rotational crops due to the higher labor demand for constructing and maintaining furrow wells and maintaining drip lines (Fig. 1, Supplementary Tables 1–5). Focus groups provided information that rice farmers who rotate will often use custom labor for the required tractor work, and therefore investment costs in equipment were not a substantial barrier in this study for rotational crops (Supplemental Tables 6-9). Realistically, certain regions may have more access to contract workers than others, and therefore human resource barriers may exist geographically34. Research shows that operating costs are often higher for diversified farms, as they require equipment that may be used only at certain times of the year or only for specific crops, as well as more labor14,37. In contrast, in a recent survey rice growers reported that labor requirements were a top priority affecting management decisions, along with water availability, profitability, and land stewardship38. Most rice farms are family operations requiring little outside labor, which favors specialization and monocropping. Despite labor costs being higher for rotational crops, total costs remained lower, except tomato, further suggesting that financial barriers are not as important as human resources and time management requirements24,25,39. n nA strength of our study was quantifying opportunity costs, or the time farmers spent learning a new system and finding markets compared to generating income through rice12,26,27. We hypothesized that opportunity costs would negatively influence farmer decision-making and the economic potential of rotational crops. Sunflowers had the highest opportunity costs relative to total costs (18% or $810 ha-1) (Fig. 1, Tables 1 and 3), mostly due to challenges in finding markets and contracts each season (Supplementary Tables 6–9). Tomato had an equally high opportunity cost at $803 ha-1, though this was a relatively low percentage of its total costs (Tables 1 and 3). The opportunity cost for tomato was mostly due to the time it takes to learn how to manage drip irrigation and find contract labor for planting (Supplementary Table 10). Our results are conservative because based on focus group outcomes, we assumed most of the labor for tomato, sunflower, and beans, including drip line placement, planting, and harvesting, was contracted out to companies or neighbors (Supplementary Tables 6–9). Therefore, without these contracting agreements, both tomato and sunflower would have significantly higher opportunity costs if the rice grower was performing these operations. Carlisle et al.37 discussed the need for “ecologically skilled labor forces” for farming communities to support the adoption of knowledge-intensive practices that tend to be aligned with more diversified systems. This could help address labor constraints and the extra time needed for learning new equipment and production practices and developing relationships for market access. n nComparing different cropping sequences and their corresponding cash flows helps illustrate how investment costs in early years may affect long-term profits, a key motivation in grower decision-making. Few agricultural studies have used a Monte Carlo analysis to assess the risk of different agricultural systems based on variable outcomes22,29,40,41. Our results show that both rotation scenarios produced lower annual NPV when switching from rice to a rotational crop due to higher capital costs, opportunity costs, and transitional costs (Fig. 3). Yet, having tomatoes in the rotation for several years afterwards helped greatly increase NPV for RSTT, while profits for the rotation with beans and safflower (RSBB) never exceeded rice. Presenting these financial fluctuations and investment requirements is important for determining risk factors during years where farmers may have reduced annual income42,43,44. n nAn important finding is the relatively long payback period, or time it would take to recoup investment costs and achieve net profits for crop diversification compared to continuous rice. Due to extra investment costs, which included opportunity costs for all crops and sub-surface drip irrigation for tomatoes and sunflower, RSTT only became more profitable than RRR by year 12 and RSBB was never more profitable. Although RSBB had much lower investment costs, it reduced profits by more than 50% compared to RRR by year 15 (Fig. 4A), suggesting lower feasibility for rice growers who are accustomed to relatively high costs of production, but also high rice yields and revenue on an annual basis. DeVincentis et al.23 found that farmers in California may not see profits when adopting winter cover crops for 15 years or more, concluding that without external incentives, farmers were unlikely to adopt cover crops. This research and others demonstrate that integrating diversification practices such as crop rotations can reduce profits in the short-term due to high investment costs18,20,21,22,45,46. n nCapital costs (irrigation system and drip line) were the biggest financial investment impacting how fast profitability was realized when rotating with tomato and sunflower. Annually, capital costs were only 7% of total costs for RSTT when spread across their expected lifespan (15 years for the pump, and 3 years for drip line). However total investment was estimated to be on average $4375 ha-1 for the pump system and $875 ha-1 for drip line (Supplementary Table 10). Koech et al.47 also found that financial constraints are major barriers to investing in irrigation technologies. Farmers will not invest in drip irrigation unless they can get multiple years of use out of it. Therefore, rotations with drip irrigation must remain out of rice for a longer period, which may also disincentivize farmers who specialize in rice. The rotation timeframe of only three years in this study may not be enough to invest in drip irrigation and should be considered a minimum. Tomato farmers will often keep drip lines in for 5 years or more to benefit from the value and reduce the required labor for removing and inserting drip lines46. Safflower, sunflower, and beans had lower irrigation costs compared to rice (Table 1), and these crops can all be grown using furrow irrigation which requires less investment. Safflower and sunflower are also known to have very low water requirements, making them a viable option during reduced water years48,49. n nWhen the potential benefits of crop rotation were considered, the break-even point for profitability was reduced for both rotation scenarios (Fig. 4C). Assuming higher rice yields and lower herbicide costs, both rotations became more profitable than RRR after 10–13 years (Fig. 4C). Growers have reported yield benefits with rotation34 but this is not a guaranteed outcome and further field research under different crop sequences and production conditions is required. Zhou et al.45 found that crop rotation intensification practices increased rice yield by at most 4.6% while Feng et al.20 found crop rotations with rape seed increased rice yield by 20%. Meanwhile, White et al.50 demonstrated that higher yields with lower input costs was a major determinant of rice profitability. n nWith the additional introduction of two fallow years in continuous rice, RSBB-benefit matched RRF profits after 6 years (Fig. 4D) and RSTT-benefit matched RRF after 9 years (Fig. 4D). This finding suggests that achieving higher profits may take longer investment and more financial security. While RSTT was much more profitable than RSBB over the 15-yr period, if agronomic and water-related benefits of rotation are realized, the break-even point was shortest for RSBB-benefit, suggesting it could be the most feasible option for farmers with limited time, capital, or human resources. This is because the combined production costs for safflower and beans were around 60% lower than sunflower and tomato. In terms of profit, RSBB-benefit only produced slightly higher cumulative NPV compared to RRR and RRF, but in terms of payback time, RSBB-benefit was the lowest at 6 years due to lower investment costs. The fact that break-even points are switched for rotations when including benefits highlights the different dynamics and interplay between long-term profitability, investment costs, and payback period. Zabala et al.14 found that crop choice rather than crop diversification practice was more important for economic impact. Our results suggest that profit depends on both the crop choice and agronomic benefits produced by diversification7,45,51,52,53. n nExploring the probability of outcomes using Monte Carlo simulations provides a better understanding of the risk management farmers are facing. Under the presumption of fallowing in RRF, RSTT-benefit and RSBB-benefit had a very high likelihood of being more profitable than rice (between 80 and 95%). However, without fallowing and without agronomic benefits, risk increases for rotations and RSTT had only a 55% or less chance of being as profitable as RRR, while RSBB was rarely as profitable as RRR (Fig. 5). These outcomes suggest that rice-based rotations including high cost – high revenue or low cost – low revenue crops are most likely to succeed financially over the long-term under the premise of rotational benefits related to enhanced crop yields and the ability to grow crops with lower water requirements when faced with water scarcity in drought years. For rotations to be successful, farms must also have the ability to withstand reduced profits for anywhere between 6 and 12 years, depending on the investment requirements and frequency of reduced water allocations causing fallowing in continuous rice (Fig. 4D). Having a break-even point of 6–12 years is a major disincentive for rotation, similar to outcomes for cover crops in DeVincentis et al.23, and it becomes understandable why continuous rice continues to be the dominant practice. n nThere are limitations to our economic analysis and underlying assumptions. Financial circumstances are different for every farmer, and changes in important costs (e.g., irrigation) or revenue (e.g., crop yield or prices) would make rotations more or less feasible, hence results do not predict farm-level outcomes. We tried to capture such variability using Monte Carlo simulations based on grower-reported ranges for production costs and county-level changes in yield and crop prices. Although our interpretation regarding profitability above focused on average outcomes, the variability illustrated in distributions reveal more nuanced possibilities. For example, environmental constraints such as soil limitations have been cited as negatively impacting yields of rotational crops in rice fields33,34. We accounted for lower yields by skewing the revenue distributions of rotational crops, helping test the hypothesis that this would negatively affect profitability. Yet, the lower quartile of simulations for tomatoes and sunflowers suggested these crops